I wanted to create vibrant, high-level network diagrams for marketing purposes. OSS tool FossFLOW appeared in my news feed recently, and I decided to give it a try. I was lazy and just ran the test instance on Stan’s web page. A more comprehensive tool is delivered on a Docker container to install on the platform of your choice. The online version only saves the session, and you can export json data to save the whole project. You can export final diagrams as PNG images.
The user interface is quite simple. For a new user it took some time to get comfortable with it. On the left corner you have the main menu, and on the right corner the toolbar. Tool selection tends to default to the pan tool and not stick to the select tool, which is a bit annoying. Tools have simple shortcut keys for CLI jockeys, and undo/redo is also available.
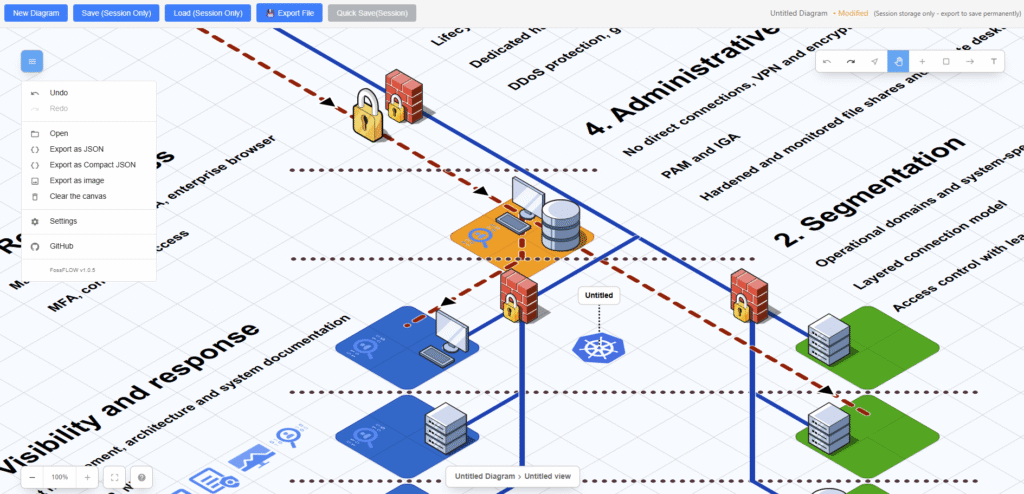
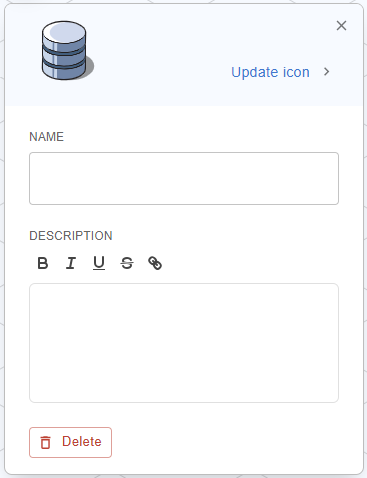
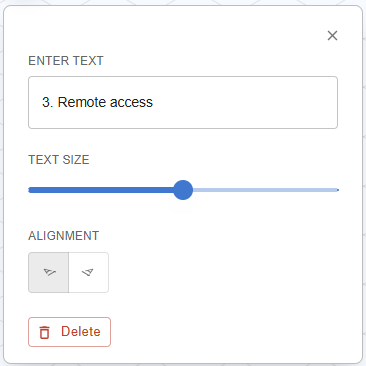
Workflow is simple: you put nodes on the canvas and connect them with lines. Canvas consists of rectangles (background blocks) that can be colored, and they define the grid for objects. Canvas seems to be endlessly scaling in every direction, and you can zoom it in and out. Everything is positioned at 45 degrees, which looks groovy. You can add text, which is also diagonally positioned and thus a bit difficult to read. Objects are deleted through their settings menu through the delete button.
Nodes have a selectable icon, name, and description, which can include links. Built-in icon library includes 3D isometric icons and AWS, Azure, GCP, and Kubernetes catalogs. The isometric catalog is quite limited, but I think it is also good for keeping diagrams simple and high-level. Cloud and K8s collections are then more comprehensive, but icons are flat, not 3D, which makes them appear different. You can’t adjust icon size or color. Isometric icons have different colors by default. Maybe they could all be steel grey to appear more coherent.
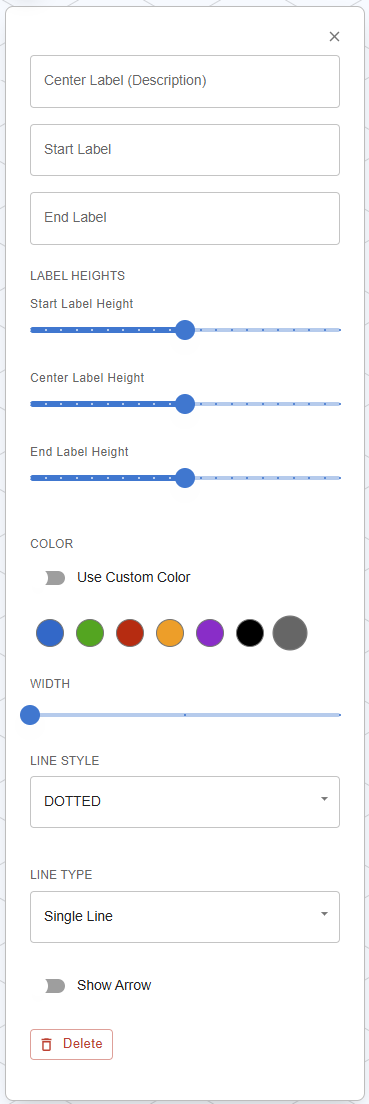
Lines (connectors) are pulled between nodes. Line sticks to nodes so that you can move nodes, and the line will follow. But once you have glued the line to the node, you can’t move the line anymore. The only workaround I find is to delete the line and create a new one. Line has several parameters to adjust: label, width, color, style, and arrows. The line is automatically routed by the system, and you can’t change that.
Text blocks have three options for font sizes and two diagonal alignment directions. Font can’t be changed. Text wrapping is automatic, which makes alignment and positioning harder. One text line is always individually positioned within one canvas rectangle.
PNG export lets you choose the background color and whether to show the grid or not. The exported image has odd scaling with a large empty canvas around the actual diagram. You can’t insert the title or additional elements into the picture. To finalize the diagram, I had to copy the image to Visio and add some extra borders and headings to it.
I made this quick infographic-style diagram for “OT Infra Top 5 Cyber Risks”. I find visualization slightly more refreshing compared to standard Visio drawings. 3D isometric layout makes the diagram more zappy. However, you can draw a similar diagram with Visio as well, and then you have full control over elements. But that’s a bit of an unfair comparison.
My overall experience with this tool was positive. Learning to use it effectively took only minutes, not hours. There was a recurring fatal crash when touching one node or line connected to it. I had to start several times over by importing the exported json file. A week later, I couldn’t replay this bug anymore. I noticed just a few minor inconsistencies in usage, but basically the program works well.
FossFLOW was a fresh and simple tool to give network diagrams a new image and feel. I think it is best suited for high-level architecture and workflow mapping. I didn’t try to make larger or more complex diagrams. The tool is usable for people who are not used to working with complex diagramming tools. With some additional features and coherent user experience, it would be a productive tool to work with. Already now it’s a nice addition to the network diagramming toolset.